OSEBX in for a correction?

After having topped, and turned at the 76.40 fibb-level, OSEBX (Oslo Stock Exchange Benchmark) today closed below the support levels of the 45 day moving average, and doesn't have any new clear technical support level before the 61.80-fibb and the 255 dma. Are we in for a correction of 9-10 per cent? From a technical point of view if definately looks like it.

(click image for full size)

I personally consider this index to be overbought, and with the uncertainty that surrounds the equity markets alongside what looks to be a reduced risk of inflation for the time being, at least myself have already allocated my personal portfolio out of equities into short-term money-market instruments.

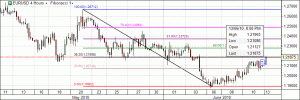
I wonder how this short EURUSD trade will end

I have a small position open short EURUSD at avg 1.21331 , which was set at an extremely bad timing before we had a spike in EURUSD around 11:00 GMT.

The spike brought us to my 38.20 fib level around 1.2190. Where are we heading next? will I get to close the short below the 23.60 at 1.2075? time will show .. In the meantime I'm just glad its a small position to entertain myself with this Monday morning

(click image for full size)

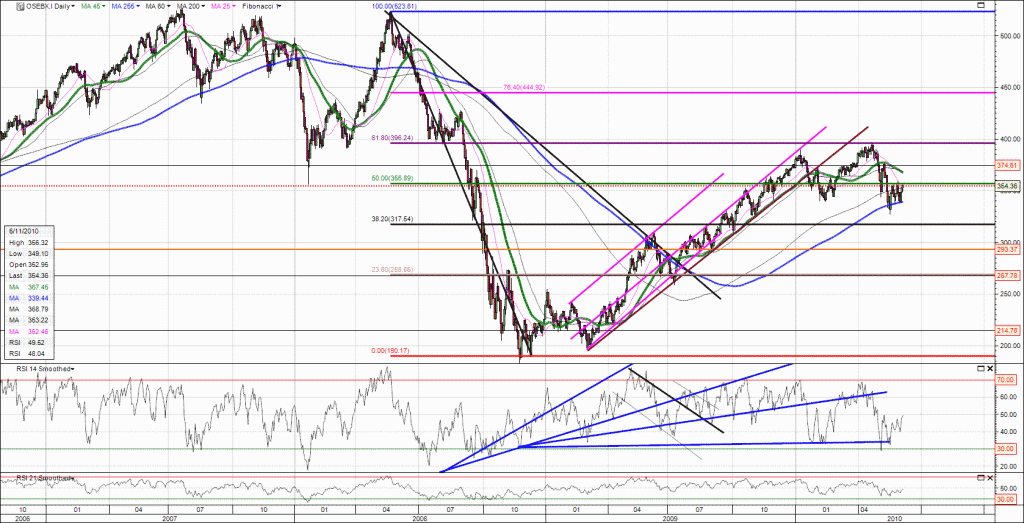
Technical update on the OSEBX

The Oslo Stock Exchange Benchmark Index is facing an interesting time ahead. Currently the technical focus is the downtrend of the RSI and resistance levels at the 50% fibonacci level around 356 points and the 45 daily moving average at 368. For support we have the 255 daily moving average around 340. All in all we consider the risk/reward to be low at this point for longer-term investors.

(click image for full size)