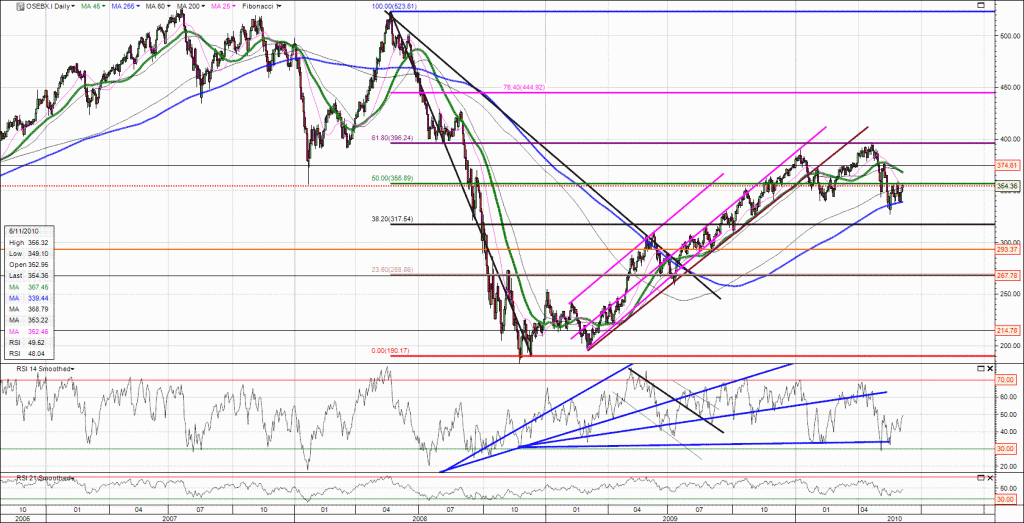
The Oslo Stock Exchange Benchmark Index is facing an interesting time ahead. Currently the technical focus is the downtrend of the RSI and resistance levels at the 50% fibonacci level around 356 points and the 45 daily moving average at 368. For support we have the 255 daily moving average around 340. All in all we consider the risk/reward to be low at this point for longer-term investors.
Category: OSE
Overweight OSE again
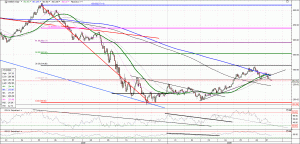
OSEBX closed at 261.59* this friday. At these levels we consider the risk reward of long position to be profitable and increase weights in equities on the oslo stock exchange again.
(click image for full size)
We expect institutional investors to start joining from the sidelines and form an upward pressure. The main concern is the low liquidity/volume in the market, which can postpone the recovery. However, these levels are good entry points for long term positions.
* OBX (25 most liquid stocks) ended at 234.79
Neutral position
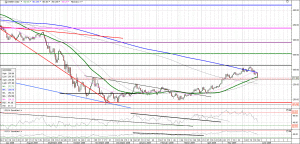
After a correction of the oslo stock exchange benchmark index (osebx) of roughly 13%, breaching below the 45 day moving average of 275 (closing at 270.49) we now change our bearish opinion to a neutral one.
(click image for full size)
Focus is on stockpicking rather than sector allocation, finding companies that shows good cashflows. Earnings season is ahead, and we expect there to be profit warnings (PWs) ahead of these, so thread careful.


